#R0identifier="07264cc47ad5ea82fdc18c686fbb9ba7"
This post is licensed under a Creative Commons Attribution-NonCommercial-NoDerivatives 4.0 International License., except where otherwise noted.
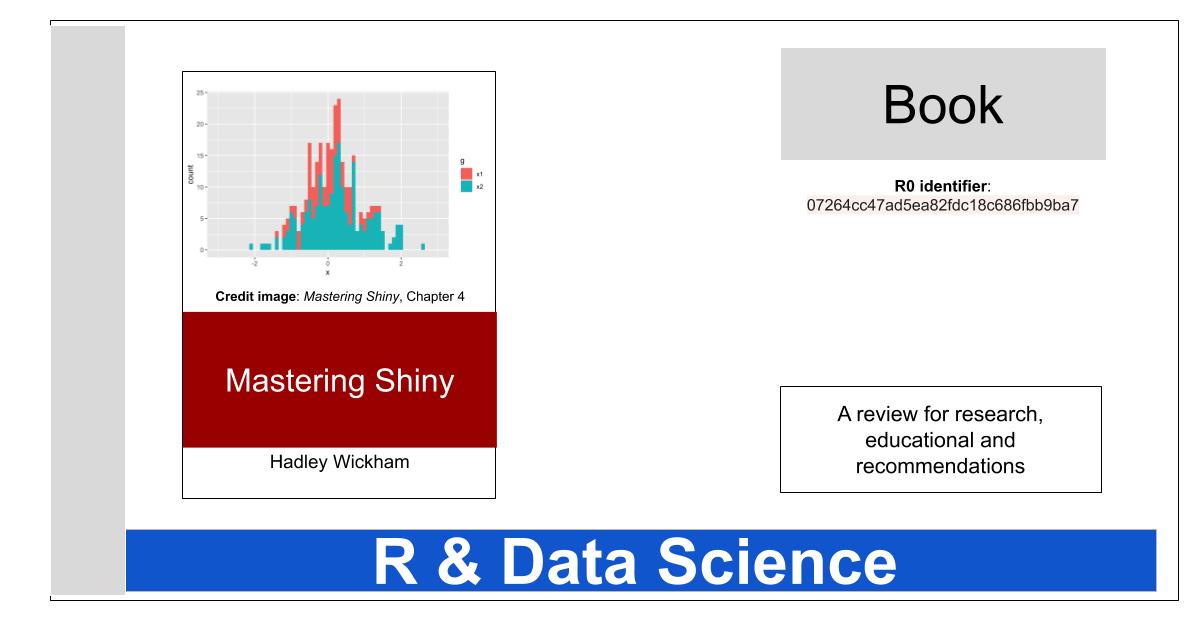
🔘 Book page: mastering-shiny.org
Overview
» […] Today, Shiny is used in almost as many niches and industries as R itself is. It’s used in academia as a teaching tool for statistical concepts, a way to get undergrads excited about learning to write code, a splashy medium for showing off novel statistical methods or models. It’s used by big pharma companies to speed collaboration between scientists and analysts during drug development. It’s used by Silicon Valley tech companies to set up realtime metrics dashboards that incorporate advanced analytics». (Source: mastering-shiny.org).
Author
[Unofficial biography. For informational purposes only]
Hadley Wickham
He is an Assistant Professor and the Dobelman FamilyJunior Chair in Statistics at Rice University. He is an active memberof the R community, has written and contributed to over 30 R packages, and won the John Chambers Award for Statistical Computing for his work developing tools for data reshaping and visualization. His research focuses on how to make data analysis better, faster and easier, with a particular emphasis on the use of visualization to better understand data and models.
Liked this post? Follow this blog to get more.