AI and the economy · Manufacturing and industrial supply chains
A factory gains little from an accurate prediction if nobody can act on it. An early warning of equipment failure becomes valuable when a maintenance team can obtain the part, schedule the repair and prevent disruption. The economic question is how reliably AI improves the whole production process, after the costs of putting it to work.
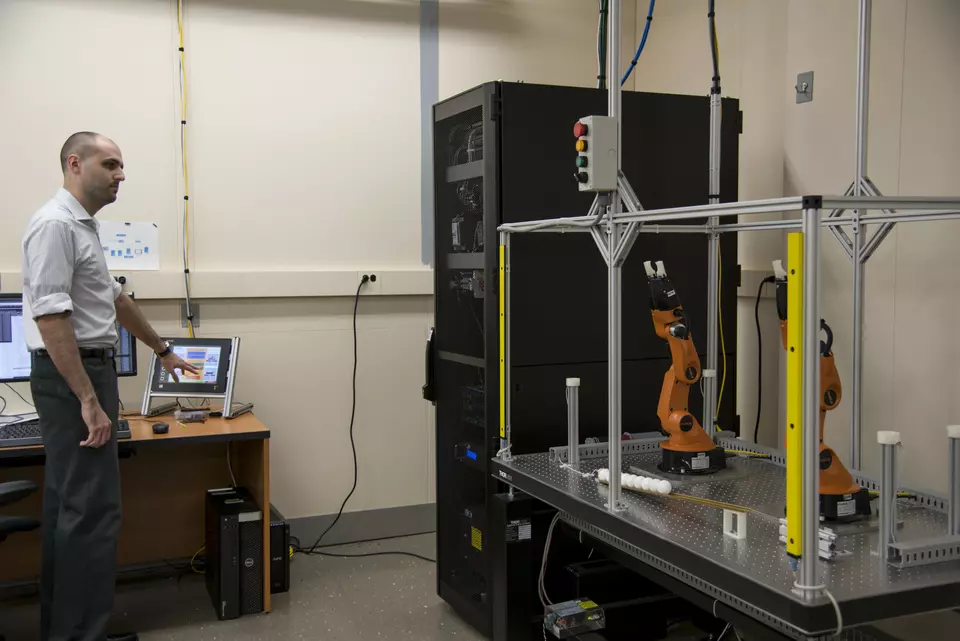
Photograph: F. Webber/NIST. Uploaded 2 October 2017. Original photograph · NIST reuse terms. Reduced-resolution version supplied by NIST; no further alteration.
From individual applications to industrial performance
Manufacturing transforms materials and components into goods. This article follows AI within factories and their supplier relationships, including inspection, maintenance, scheduling and information exchange. Conventional automation and industrial robots are not automatically AI: the relevant systems infer predictions or decisions from data. The OECD’s manufacturing review describes opportunities to detect defects, anticipate failures and coordinate operations, alongside difficulties with data, integration and dependable performance. [1, chapter 4]
Economic value can take several forms: fewer rejected products, more dependable deliveries, reduced resource use or better goods. A faster task contributes only when it improves an outcome that matters elsewhere in the process. If the next machine remains the bottleneck, faster inspection need not increase finished output. Any assessment must therefore include installation, training, downtime, maintenance and recurring charges, as well as the benefits.
Sector profile: three distinct windows on adoption
The following indicators retain their original populations and years. Enterprises, establishments and workers are different units; these figures do not constitute a regional ranking.
European Union
17.27%
Of EU-27 manufacturing enterprises with 10 or more persons employed used at least one surveyed AI technology in 2025. Eurostat’s NACE Rev. 2 section C measure covers business uses, not just production. [2]
United States
22.8%
Of manufacturing establishments used some form of AI in 2021, in a weighted Census-linked study. Its approximately 28,500-establishment sample provides a historical benchmark for research on industrial adjustment, not a current adoption estimate. [3, table 1]
Japan
8.9%
Of surveyed manufacturing employees were classified as AI users at work in 2024. The JILPT survey, analysed by the OECD, includes 4,708 manufacturing respondents. This measures workers’ interaction with AI, not the proportion of factories adopting it. [4, chapter 1]
Japan supplies the Asian evidence here; the findings are not extrapolated to China, South Korea, Taiwan, India or ASEAN economies. More recent US business surveys also require care: the Census Bureau broadened its question in November 2025 from use in producing goods or services to use in any business function. A change in reported adoption across that boundary cannot be read entirely as technological diffusion. [5]
Using AI in a manufacturer is not the same as using it in production

| Reported use | Enterprises (%) |
|---|---|
| Any surveyed AI technology | 17.27 |
| Marketing or sales | 5.25 |
| Administration or management | 4.67 |
| Production processes | 3.49 |
| Logistics | 1.15 |
Administrative applications may be economically useful. Nevertheless, the 3.49% reporting use in production demonstrates why a general adoption statistic cannot establish how extensively factory operations have changed. These are reported uses, not measured returns, and the survey excludes enterprises below the employment threshold. [2]
The return may take time, and may not arrive everywhere
McElheran and colleagues link US manufacturing surveys and administrative data to examine industrial AI before the widespread availability of generative AI. Their working paper finds initial productivity and profitability losses, with stronger later growth among earlier adopters that survive. Results vary with organisational characteristics. Its causal interpretation relies on an instrumental-variable strategy and related assumptions, rather than random assignment; expertise must affect performance through adoption in the relevant analysis. These findings neither guarantee eventual gains nor establish returns to today’s generative systems. [3, sections 3–5]
The practical implication is to follow implementation over time, including unsuccessful projects. A useful evaluation compares quality-adjusted output and total resource costs with a credible baseline, records disruption during installation, and checks whether improvements persist. It should also distinguish a process improvement from stronger demand, higher selling prices or an unrelated equipment replacement. Otherwise, a profitable year may be attributed to the wrong cause.
A 2026 Federal Reserve staff review reaches a similarly cautious conclusion at a different scale: evidence of AI’s contribution to aggregate US productivity remains limited, despite rapid investment and adoption. Most of its analysis was completed in June 2026. This macroeconomic assessment cannot settle the performance of an individual factory. [6, sections 7–8]
What the worker survey reveals
JILPT’s online survey ran from late May to late June 2024, covering 22,000 Japanese workers. Sample allocation used the 2020 census to reflect demographic characteristics. Among 418 manufacturing AI users, 71.3% expressed some worry about losing their job to AI within ten years. The category includes slight worry. [4, figure 3.2]
This is a report of concern, not a probability of dismissal. The OECD account does not specify a separate weighting procedure for this item. Differences in timing, definitions and survey populations prevent a direct comparison with enterprise adoption rates. Workers’ responses identify an issue to investigate alongside observed changes in tasks, pay and employment.
Who bears the costs, and who receives the gains?
A supplier may improve delivery reliability while accepting additional costs for data preparation and connection to a customer’s systems. A manufacturer may retain savings, pass them to buyers through prices, or use them to expand production. These are possible distributional channels, not outcomes established by the adoption figures. Measuring them requires evidence on contracts, prices, margins and investment across the supply chain.
The OECD identifies practical constraints on industrial deployment, including data quality and compatibility with existing equipment. Smaller suppliers may face particular difficulties assembling the necessary expertise. Better predictions can support maintenance and reduce waste, but false alarms can interrupt production and missed faults can compromise quality. The economic calculation must include the consequences of errors. [1, chapter 4]
The ILO’s April 2026 manufacturing meeting adopted tripartite conclusions addressing productivity, skills, occupational safety, working conditions and social dialogue. They recognise opportunities to reduce hazardous or repetitive tasks, alongside risks involving job displacement, inequality and workplace data. These are sector-specific recommendations, not an estimate of net job creation. [7, paragraphs 3–14]
For workers, a better process should be assessed through safe work, access to training and the distribution of gains as well as output. For suppliers, dependable demand and transferable capabilities matter. For customers, the test includes quality, availability and price. An investment earns its economic justification when these outcomes can be demonstrated over time, with its costs and failures included in the account.
Method and scope
This focused narrative review combines official survey statistics, empirical working papers and institutional assessments available on 21 November 2026. Historical observations remain dated; neither national totals nor worldwide employment effects are inferred from them. The chart uses one population and year. The analysis identifies conditions for evaluating returns, without estimating a universal financial payoff.
References
- OECD. (2026). Progress in Implementing the European Union Coordinated Plan on Artificial Intelligence (Volume 2): Uptake in High-Impact Sectors, chapter 4, “AI in manufacturing”. OECD Publishing. doi:10.1787/3ac96d41-en.
- Eurostat. (2026 update). Artificial intelligence by NACE Rev. 2 activity, dataset isoc_eb_ain2; EU27_2020, C, GE10, PC_ENT, 2025. doi:10.2908/isoc_eb_ain2.
- McElheran, K., Yang, M.-J., Kroff, Z., & Brynjolfsson, E. (2025). The Rise of Industrial AI in America: Microfoundations of the Productivity J-curve(s). CES Working Paper 25-27, April. US Census Bureau. Paper.
- OECD. (2025). Artificial Intelligence and the Labour Market in Japan, chapters 1 and 3, figures 1.2, 1.5 and 3.2. OECD Publishing. doi:10.1787/b825563e-en.
- Grundy, A., Breaux, C., & Khatiwoda, D. (2026, 26 May). Large Firms With at Least 20 Employees Biggest AI Users. US Census Bureau, America Counts. Survey explanation.
- Carollo, N., Crane, L. D., Garcia Molina, D., & Nichols, J. (2026). Artificial Intelligence and the U.S. Economy: Current Evidence. Finance and Economics Discussion Series 2026-074. Federal Reserve Board. doi:10.17016/FEDS.2026.074.
- International Labour Organization. (2026). Conclusions and recommendations: Technical meeting on challenges and opportunities for promoting decent work, productivity and a just transition arising from artificial intelligence in the manufacturing industry. TMDWAI/2026/8, adopted 17 April. Conclusions.
Liked this post? Follow this blog to get more.