Energy and data-centre infrastructure
The economic value of computing depends partly on the electricity system around it. Expanding that system raises a question that investment announcements cannot answer: how will the costs and risks be shared?
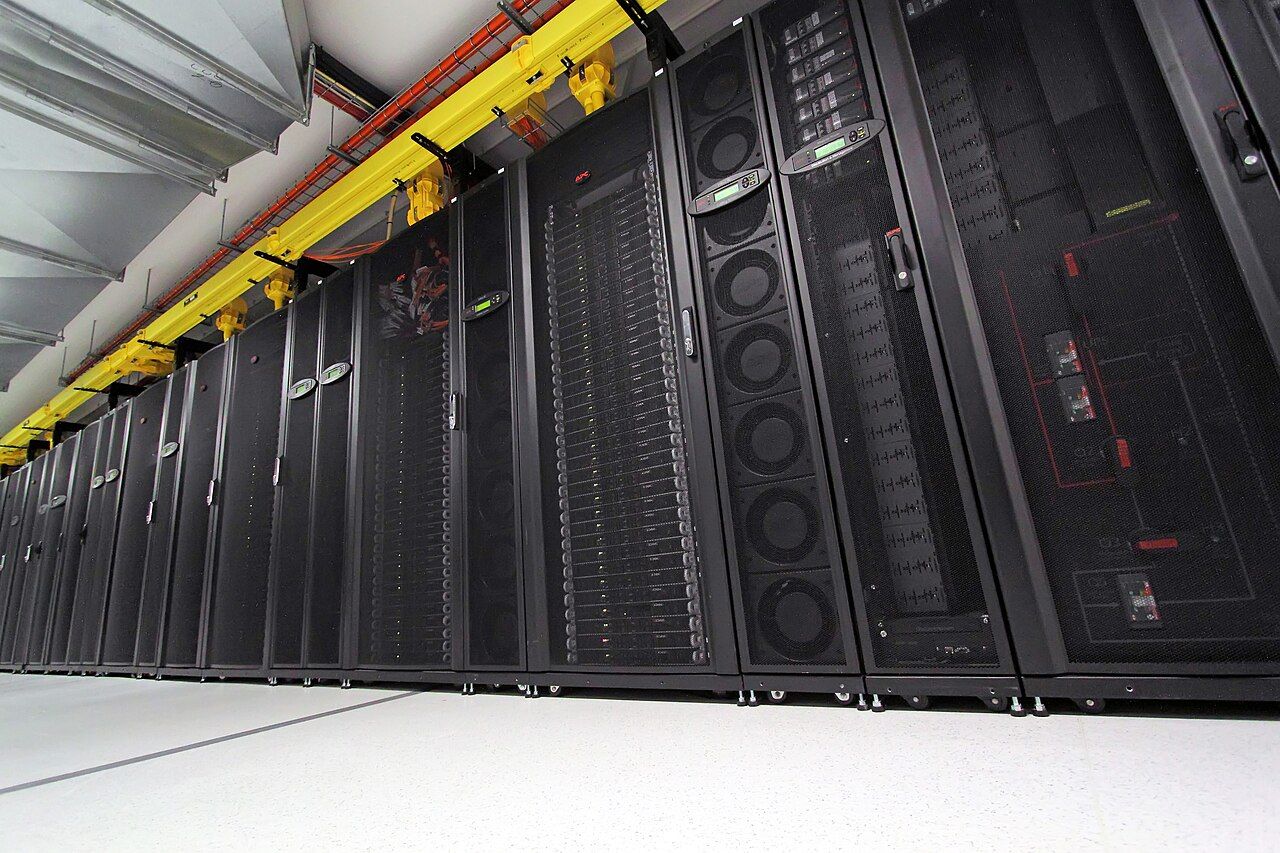
Photograph: CSIRO, 2012. Original and attribution record · CC BY 3.0. Wikimedia’s reduced-resolution version; no further alteration. Historical illustration; the photograph does not identify an AI workload.

AI services require servers, cooling and a reliable power supply. Their growth connects decisions made by technology companies with infrastructure used by households, hospitals and other businesses. A larger computing industry can enable valuable services. Its electricity demand, however, is an input into production, not a measure of the value created.
The International Energy Agency’s April 2026 outlook estimates global data-centre electricity consumption at 485 terawatt-hours (TWh) in 2025 and projects 950 TWh in 2030. These totals cover data centres generally; they must not be described as electricity used exclusively by AI. The later figure is a central projection, rather than an observed result.[1]
A sector profile with separate statistical boundaries
The sector considered here comprises data-centre operations and their connection to electricity infrastructure. It is a functional grouping, not a single harmonised industry code. The following figures describe electricity consumption; they are not estimates of sector turnover, employment or AI’s contribution to GDP.
European Union
68 TWh · 2024
The Commission reports this estimate for EU data centres. Its 2030 projection is 114 TWh. The geographical scope is the EU, rather than Europe as a whole.[2]
United States
192 TWh · 2024
The June 2026 Berkeley Lab update estimates 4.7% of US electricity consumption. This is a model-based historical estimate, not a complete meter-by-meter census; cryptocurrency mining is excluded.[3]
China
25% · 2024
The IEA’s 2025 report attributes this share of global data-centre electricity consumption to China. It is a historical benchmark with a different unit and source, not an estimate for Asia as a whole.[4]
These sources have different methods and revision dates. Their projections should not be added together, or divided by the global projection to manufacture regional market shares. Japan provides a policy example through its Watt-Bit initiative, which links computing infrastructure and electricity-system planning. Singapore’s March 2026 parliamentary response describes calibrated expansion within environmental and resource constraints, without a predetermined overall capacity ceiling. Neither policy description measures a realised productivity gain.[5][6]

| Year | TWh | Status |
|---|---|---|
| 2025 | 485 | Historical estimate |
| 2030 | 950 | Central projection |
Investment is a commitment before it is a benefit
The IEA’s October 2026 review expects the largest hyperscalers to spend more than US$700 billion in capital expenditure during 2026, mostly on new data centres. This is an expectation for a defined group of companies, not a completed global investment total or an estimate of additional GDP.[5]
For economic assessment, several stages need separate observation: a project announcement, construction expenditure, an operational connection, utilisation and the services subsequently produced. An imported server adds to investment expenditure but also to imports; its purchase price cannot simply be counted as domestic value added. Likewise, spending on replacement equipment and new capacity has different implications. The benefits ultimately depend on useful output, operating costs and how efficiently assets are used.
A similar distinction applies to jobs. Construction, ongoing operations and employment in firms using the resulting services are different categories. A credible local assessment would record them separately, alongside training, wages and working conditions. It would also identify public support and any alternative uses of scarce land, water or grid capacity.
What operators report
Uptime Institute’s online survey ran in April–May 2026. More than 800 owners and operators participated; the survey’s Figure 1 reports 537 responses to a question about management concerns over the following year. Adding its two higher concern categories gives 79% for costs and 64% for power availability.[7]
| Issue | Very | Somewhat | Total |
|---|---|---|---|
| Costs | 38% | 41% | 79% |
| Power availability | 35% | 29% | 64% |
Who carries the risk?
The IEA identifies circumstances in which new demand can raise other customers’ bills, and circumstances in which fuller use of existing assets can spread fixed costs. The outcome depends on local conditions and cost allocation. Its review discusses measures including minimum-payment commitments, phased connections and exit provisions to address the risk that reserved capacity is underused, abandoned or never connected.[5]
That makes the terms of infrastructure provision economically significant. A community needs to know which costs the operator will meet, what happens if demand falls short, and whether the claimed benefits remain after public support and additional system costs are considered. Reporting a larger electricity requirement answers none of those questions on its own.
The ILO’s November 2026 policy brief places skills, worker protection and access to digital infrastructure within a wider agenda for decent work. This is general policy guidance for developing economies, not a sector-specific estimate of employment created by data centres.[8] Its relevance here is to keep the distribution of benefits visible: reliable infrastructure and valuable services matter alongside the scale of investment.
Evidence and limits
This assessment uses sources available on 19 November 2026. Historical consumption estimates, model projections, policy descriptions and survey perceptions answer different questions. None of the evidence presented establishes the net causal effect of AI infrastructure on national productivity, household tariffs or employment. The appropriate next observation is therefore concrete: what became operational, what it produced, what it cost, and who paid.
References
- International Energy Agency. (2026a). Key Questions on Energy and AI. 16 April. Executive summary and electricity-demand outlook. Source. Accessed 19 November 2026.
- European Commission. (2026). Report on the energy efficiency of data centres in the EU. COM(2026) 500 final, 21 September, section 1. Source. Accessed 19 November 2026.
- United States Data Center Energy Usage Report: 2025 Update. (2026). Lawrence Berkeley National Laboratory, 18 June, pp. 8–9 and Table 2. DOI: 10.71468/P1RP4F. Source. Accessed 19 November 2026.
- International Energy Agency. (2025). Energy and AI. Executive summary; geographical distribution of electricity consumption in 2024. Source. Accessed 19 November 2026.
- International Energy Agency. (2026b). Powering Artificial Intelligence: Strategies for integrating data centres into electricity systems. 14 October; executive summary, sections on grid integration and affordability. Source. Accessed 19 November 2026.
- Ministry of Digital Development and Information, Singapore. (2026). Response to PQ on Limits on Singapore’s Total Data Centre Capacity. 3 March. Source. Accessed 19 November 2026.
- Uptime Institute. (2026). Global Data Center Survey 2026: Executive summary. July; p. 4, Figure 1. Source. Accessed 19 November 2026.
- International Labour Organization. (2026). AI and developing economies: Promoting decent work in a time of rapid technological change. Policy brief, 4 November. DOI: 10.54394/00035656. Source. Accessed 19 November 2026.
Liked this post? Follow this blog to get more.